The Library of Monitoring Objects, part 1
Suppose you plan to collect data from one or many computer systems you have in your data center. What data would you collect and what summary statistics would you store for those metrics ? Would it be ok, to sample every 60 seconds data from each host, or would you need to sample at second level ? How about keeping all metrics as statistics, aggregated over time or would you want to keep as well the raw data associated with those statistics !?

All these questions need to be answered when you conduct a performance monitoring setup to a site.
Short answer: it depends what you plan to do. If you want to be able to monitor all hosts for their availability only, probable you don't need much. But if you want to be able to answer about current utilization level, per system resource, across a large number of operating system, you will need to record a lot more data from each system and store it. A sampling interval of 60 seconds would be plenty. But still you wont need thousands of metrics to understand when you are short of memory or you need to add another CPU, or have a disk IO issue. However if you need to go deeper, being able to answer why some Java application is that slow, between 4 and 6PM, you probable need to record even more data, including the application itself data, Java Virtual Machine GC statistics.
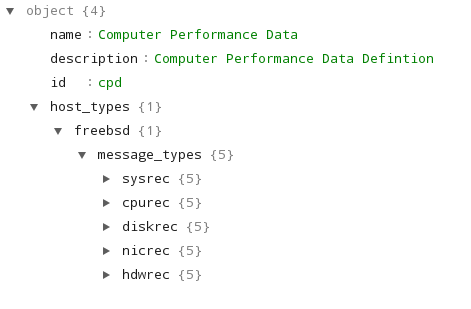
For example, 5 different message types from a FreeBSD system: sysrec, cpurec, diskrec, nicrec and hdwrec, each having a structure and a number of data fields:
What metrics per message ? See below:

Next time, we will show you one complete message type for collecting per cpu statistics from a Linux, FreeBSD and Solaris host.
All these questions need to be answered when you conduct a performance monitoring setup to a site.
Metrics
So, what metrics do you need ? You have lots of different systems, RedHat Enterprise Linux 5.x and 6.x, Solaris 10, 11, lots of Windows servers. So how do you know what metrics are useful and what are simple waste ... and how would you be able to understand and explain what is going on with your computing infrastructure ?Short answer: it depends what you plan to do. If you want to be able to monitor all hosts for their availability only, probable you don't need much. But if you want to be able to answer about current utilization level, per system resource, across a large number of operating system, you will need to record a lot more data from each system and store it. A sampling interval of 60 seconds would be plenty. But still you wont need thousands of metrics to understand when you are short of memory or you need to add another CPU, or have a disk IO issue. However if you need to go deeper, being able to answer why some Java application is that slow, between 4 and 6PM, you probable need to record even more data, including the application itself data, Java Virtual Machine GC statistics.
The library
Start with the operating system. There are lots of performance metrics to understand and check what's going on. But which metrics are good enough to reveal an underutilized system, or a system running out of memory ? Enter LMO, a simple repository of the most needed operating system performance metrics, across a variety of operating systems, designed for computer performance data.What is it ?
It is a list of of metrics and summary statistics, specific to different data collection domains, example computer performance data, organized as message types, based on data fields, with different data types. The purpose is to describe, define, and more or less standardize these metrics which can be easily used to any software products like, real-time web analytic, data analytic software or any data reporting software, available as a JSON or XML formats.For example, 5 different message types from a FreeBSD system: sysrec, cpurec, diskrec, nicrec and hdwrec, each having a structure and a number of data fields:
What metrics per message ? See below:
Next time, we will show you one complete message type for collecting per cpu statistics from a Linux, FreeBSD and Solaris host.


Comments
Post a Comment